 po polsku
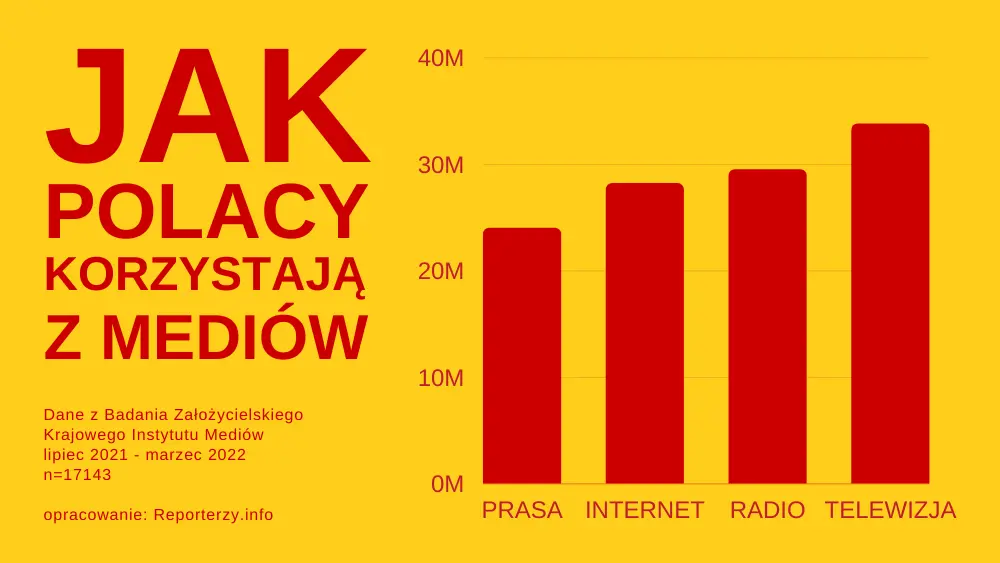 source: National Media Institute, analysis: Reporterzy.info, declarative data for the three months preceding the survey
The National Media Institute’s Establishment Survey provides insight into how and how often Poles use traditional and electronic media. Surveyors examined what devices people have at home and what they can access at work or school. The results are as follows:
- Access to TV: 92.0%
- Access to radio: 80.3%
- Access to a computer/tablet: 66.0%
- Access to a mobile phone/smartphone: 88.5%
However, access to a media device does not necessarily mean it is used regularly.
Television
In the 30 days preceding the survey, 90.2% of respondents reported watching television. This translates to 33.1 million Poles, but it’s only 96% of those with access to a TV. Conclusion: two million Poles could watch linear TV but choose not to.
In a longer, three-month period, 92.1% of respondents confirmed watching TV, equating to nearly 33.8 million people. Among age groups, those aged 65+ are the most frequent TV viewers.
- TV viewership by age group
- 4-9 years: 91.5%
- 10-15 years: 95.2%
- 16-24 years: 88.1%
- 25-34 years: 87.0%
- 35-44 years: 90.4%
- 45-54 years: 93.0%
- 55-64 years: 95.2%
- 65+ years: 95.9%
Radio
Radio listening was reported by 75.2% of respondents, meaning that 27.6 million people listened to the radio at least once in the past month. Among radio owners, nearly 8% did not turn on their device even once during the month before the survey.
In a three-month period, the number of radio listeners increases significantly, reaching 80.4% of the population, or 29.5 million people - 1.9 million more than in the one-month period. Radio is least popular among teenagers and most popular among those aged 35-44.
- Radio listenership by age group
- 4-9 years: 71.7%
- 10-15 years: 65.7%
- 16-24 years: 78.5%
- 25-34 years: 83.5%
- 35-44 years: 85.9%
- 45-54 years: 84.4%
- 55-64 years: 82.4%
- 65+ years: 77.9%
Internet
At least 76.8% of respondents use the internet occasionally. In a monthly timeframe, internet users slightly outnumber radio listeners at 28.2 million. According to the National Media Institute, the devices used to access the internet include:
- 26.4 million mobile phone owners (93.9% of internet users)
- 23.6 million computer and tablet owners (83.8% of internet users)
- 15.8 million Smart TV owners (56.2% of internet users)
Over three months, the number of internet users grows by just 300,000, indicating that those who use the internet tend to do so regularly. Among those aged 10 to 50, almost everyone surfs the web. However, over a three-month period, internet usage slightly trails radio usage.
- Internet usage by age group
- 4-9 years: 77.6%
- 10-15 years: 98.6%
- 16-24 years: 99.1%
- 25-34 years: 99.1%
- 35-44 years: 96.5%
- 45-54 years: 89.0%
- 55-64 years: 68.3%
- 65+ years: 28.7%
Print Media
Reaching for newspapers or magazines at least once a quarter is reported by 65.7% of respondents, equating to 24 million readers. Nearly half of this group also reads online editions. Over 11.3 million people, or 31% of the population, read e-publications. The older the age group, the higher the popularity of print media, with readership reaching up to three-quarters among the oldest Poles.
- Print readership by age group
- 4-9 years: 24.6%
- 10-15 years: 45.3%
- 16-24 years: 65.0%
- 25-34 years: 64.9%
- 35-44 years: 69.4%
- 45-54 years: 73.7%
- 55-64 years: 75.3%
- 65+ years: 72.8%
* * *
The National Media Institute’s Establishment Survey was conducted between July 2021 and March 2022 on a representative sample of 17,143 people aged 4 and older. Full results are available at https://kim.gov.pl/wyniki-badan/


COMMERCIAL BREAK
New articles in section Media industry
Information laundering. Russian propaganda returns as news from China
KFi
Russian intelligence agencies use complex tactics to mask the primary source of their harmful narratives. Patrycja Krzyśpiak from NASK details this dangerous process of information laundering in a recent report.
Health disinformation on the internet. Diagnosis from an algorithm
Katarzyna Czechowicz
Health disinformation can cause a cancer patient to see a doctor when it is too late for effective treatment. It can also undermine trust in doctors and public institutions. As a result, people may refuse to cooperate even during a real external threat, experts warn.
Feminatives are not a given. How Polish women talk about their professions
SWPS
Polish women still rarely use female job titles. This comes from the latest report by the Center for Research on Social Relations at SWPS University. Women's professional activity proved to be a significant factor in using feminatives.
See articles on a similar topic:
Media in Poland 2022. How Poles Watch, Listen, Read, and Surf the Web
Krzysztof Fiedorek
Nearly two million Poles have access to a TV but do not watch television. For radio, the analogous group amounts to 8% of radio owners. Two-thirds of Poles reach for printed press, even occasionally, while the number of mobile internet users exceeds desktop users by nearly three million.
The Podcast Market in Poland. Research by Wprost and Tandem Media
Krzysztof Fiedorek
How many Polish internet users listen to podcasts? Where and how do we listen? How and why do we choose episodes? Two major studies on this topic were recently released. One by Wprost, the other by Tandem Media from Agora Radio Group. We present both for data comparison and insights.
Can a Robot Be Good Boss? Researchers from SWPS Look for Answers
SWPS
A robot giving orders at work is no longer a science fiction scenario - it's a research topic. Scientists from SWPS University in Poland set out to find out whether a robot can effectively manage human workers.
Information bubbles. Study of Instagram, Tik Tok and You Tube users
Urszula Kaczorowska
A staggering 96 percent of the time people spend online is spent on anything but consuming information. This, says Professor Magdalena Wojcieszak means ‘we have over-inflated the issue of information bubbles and disinformation.’